Updated May 3, 2023
I. Introduction
The San Francisco Ethics Commission administers a public campaign financing program for qualifying candidates running for Mayor or Supervisor. The San Francisco Campaign and Governmental Conduct Code requires that “following each election at which the Mayor or members of the Board of Supervisors are elected, the Ethics Commission shall submit a report to the Mayor and Board of Supervisors” that provides certain information about the use of the public financing program in that election.[1] The report may also contain other relevant information the Commission may wish to include and provides those observations in the concluding section of the report. The Ethics Commission prepared this report to provide background for benchmarking program components across election cycles to help increase understanding of the program and maximize its effectiveness in City campaigns.
In the November 8, 2022, election, voters elected members of the Board of Supervisors representing Districts 2, 4, 6, 8, and 10. The information presented in this report is drawn from disclosure statements and forms filed by candidate campaign committees and independent committees covering activity through the period ending December 31, 2022, the last regularly scheduled disclosure period, and from Commission records of public funds disbursements to participating candidates.
II. Program Goals and Overview
The San Francisco voluntary program of limited public campaign financing for candidates was first established by Proposition O, a ballot measure approved by the voters in November 2000. Prop O established public financing for candidates for the Board of Supervisors, and in 2006 the program was expanded to include Mayoral candidates. This section discusses the program goals, describes recent program changes, and provides an overview of the program rules.
A. Program Goals
The City’s public campaign financing program serves many important public policy goals. The program seeks to ensure that candidates with a demonstrated level of community support can secure sufficient resources to mount a viable campaign. In doing so, public financing reduces candidates’ dependence on large private contributions, which lessens the potential for and appearance of undue influence by contributors and serves to improve the public’s trust in local government. Public financing also seeks to enable candidates to spend less time fundraising and more time interacting with voters and engaging in discussions on important issues. The availability of public funds also encourages citizens to be more politically active by incentivizing and empowering small-dollar contributions. By supporting candidates who have community support, public financing can also lead to more competitive races, which is important in ensuring quality representation of constituents.
B. Features of the Program Enacted in 2020
From 2018 to 2019, the Ethics Commission undertook a comprehensive review of the public financing program to strengthen its impact while also reducing unnecessary administrative burdens for participating candidates. The review project resulted in two ordinances, three sets of regulation amendments, and various improvements to the Commission’s written compliance materials regarding public financing. The project also improved the candidate application process. The November 2022 election was the second election since enacting these changes to the program.
Fundamental program updates enacted in 2020 included:
- Increasing the maximum amount of public funds candidates could qualify to receive: Candidates for the Board of Supervisors are able to qualify to receive up to $255,000, and candidates for Mayor are able to receive up to $1.2 million, as explained in Section II.C below. This change was made to allow publicly financed candidates to access funds needed to run a viable campaign as the cost of campaigning in San Francisco continues to increase.
- Adopting a new formula for allocating public funds to candidates: Public funds are matched at a rate of six-to-one up to the first $150 of eligible contributions received from any single contributor. This change was designed to encourage candidates to develop a broader base of donors and to enable smaller contributions to have a larger impact.
- Increasing candidate spending limits and revising the process for adjusting the limits: The initial level of a Supervisorial candidate’s spending limit (Individual Expenditure Ceiling, or “IEC”) is $350,000 and, as described in Section II.C below, can be adjusted upwards in increments of $50,000 based on financial activity in the candidate’s race. The initial level of a Mayoral candidate’s IEC is now $1.7 million and can be adjusted upwards in increments of $250,000 based on financial activity in the candidate’s race. The higher initial IECs and greater increases are designed to more accurately reflect the average cost of running a competitive campaign so that participating candidates may be competitive without having to rely on excessive adjustments to their IECs.
C. Program Overview
1. Program Funding Source
The public financing program is funded through the Election Campaign Fund (the “Fund”) established by the San Francisco Campaign Finance Reform Ordinance (“CFRO”). CFRO requires that the Fund receive an annual General Fund appropriation of $2.75 per resident each fiscal year.[2] Based on July 2021 Census Bureau data, San Francisco has an estimated population of 815,200.[3] This results in a required annual appropriation of approximately $2.2 million be added to the Fund. Money in the fund that is not used is required to be carried forward to the next year. Notwithstanding the baseline annual appropriations formula and the carry-forward provision, annual appropriations should not make the Fund’s balance exceed $7 million.[4] When a special election is held to fill a vacancy for the office of Mayor or Supervisor, CFRO may require additional appropriations into the Fund to ensure that sufficient funds are available to allow for the program’s effectiveness in that election.[5] Additional appropriations may occur before a regularly scheduled election as well if the Fund’s balance does not meet prescribed statutory minimums.[6]
At the conclusion of the 2020 election cycle, after disbursement of all public funds, the available balance in the Fund was calculated at $4.2 million.[7] At the start of the fiscal year beginning July 1, 2022, the available balance in the Fund was $4.7 million, as reported by the Controller’s Office.
2. Eligibility
To participate in the public financing program, interested candidates must first meet all qualification requirements of the Department of Elections to appear on the ballot. Candidates who qualify to appear on the ballot must also meet the following program eligibility requirements:
- Raise a minimum number and total dollar amount of contributions from San Francisco residents: A non-incumbent Supervisorial candidate is required to raise qualifying contributions totaling at least $10,000 from at least 100 contributors, while an incumbent Supervisorial candidate is required to raise qualifying contributions totaling at least $15,000 from at least 150 contributors. A non-incumbent Mayoral candidate is required to raise qualifying contributions totaling at least $50,000 from at least 500 contributors, while an incumbent Mayoral candidate is required to raise qualifying contributions totaling at least $75,000 from at least 750 contributors. Only contributions between $10 and $100 count as qualifying contributions.[8] These qualifying contributions must be received by the candidate no earlier than 18 months before the date of the election and no later than the 70th day before the election.
- Be opposed by a candidate who receives contributions or makes expenditures over a minimum amount: Supervisorial candidates must be opposed by a candidate who raises or spends at least $10,000. Mayoral candidates must be opposed by a candidate who raises or spends at least $50,000.[9]
- Adhere to campaign spending limits: Candidates must adhere to campaign spending limits (Individual Expenditure Ceiling, or “IEC”) which may be adjusted, as described in Section 4 below. The initial IEC for Supervisorial candidates is $350,000. The initial IEC for Mayoral candidates is $1.7 million.
In addition to the requirements above, candidates must not accept loans from others, abide by limits on the amount of funds they loan/donate to their own campaign, and agree to debate their opponents.
3. Candidate Disbursements
Once certified as eligible for the program, candidates receive an initial grant. Supervisorial candidates receive an initial grant of $60,000. Mayoral candidates receive an initial grant of $300,000. After receiving the initial grant, candidates may receive matching funds distributed at a six-to-one ratio for every dollar of contributions received up to $150 from any single contributor. Non-incumbent Supervisorial candidates can have up to $32,500 in private contributions matched (for a maximum of $255,000 of public financing), while incumbent Supervisorial candidates can have up to $32,000 in contributions matched (for a maximum of $252,000 of public financing). Non-incumbent Mayoral candidates can have up to $150,000 in private contributions matched (for a maximum of $1,200,000 of public financing), while incumbent Mayoral candidates can have up to $147,500 in contributions matched (for a maximum of $1,185,000 of public financing).
4. Spending Limit Adjustments
Based on financial activity in a candidate’s race, the candidate’s spending limit (or Individual Expenditure Ceiling, “IEC”) shall be raised by the Ethics Commission. This provision intends for candidates who are bound by a spending limit to have the ability to respond when independent expenditures and opponent fundraising exceed the candidate’s initial IEC. Three factors are assessed to determine if an increase to a candidate’s IEC is warranted: (1) contributions received by the candidate’s opponents, (2) independent expenditures in support of the candidate’s opponents, and (3) independent expenditures in opposition of the candidate. A Supervisorial candidate’s IEC is adjusted in increments of $50,000, and a Mayoral candidate’s IEC is adjusted in increments of $250,000.
Spending limits are regularly reviewed by Commission staff and adjusted on a candidate-by-candidate basis. It is therefore possible for candidates in the same race to have different IEC limits or to have their IEC adjusted at different times/intervals. As IEC limits only apply to expenditures made or accrued, it is possible for candidates to raise funds in excess of their IEC limit.
III. Information Regarding the November 2022 Election
In the November 2022 general election, all even-numbered Supervisorial districts (Districts 2, 4, 6, 8, and 10) appeared on the ballot, and candidates running in those races could apply to receive funds under the public financing program. This section provides information about the amount of funds received by these candidates (including private contributions and public financing), how much the candidates spent, changes in their respective spending limits, and independent expenditures in the races reported by third parties.
A. Candidates
The following table indicates for each Supervisorial race the number of candidates qualified by the Department of Elections to appear on the ballot and how many candidates the Ethics Commission certified as eligible to receive public financing. For the November 2022 election, five of the 11 Supervisorial candidates who qualified to appear on the ballot (45%) applied for and were approved to receive public financing.[10] For comparison, in the November 2020 election, 16 of the 26 candidates qualified to appear on the ballot (62%) were certified as eligible to receive public financing.
Table 1 – Candidates in November 2022 Election
| Supervisor Election Race | Candidates Qualified to Appear on Ballot | Candidates Applying for Public Financing | Candidates Certified Eligible for Public Financing | Percent of Qualified Candidates Certified for Public Financing |
|---|---|---|---|---|
| District 2 | 1 | 0 | 0 | 0% |
| District 4 | 2 | 3 | 2 | 100% |
| District 6 | 4 | 2 | 2 | 50% |
| District 8 | 2 | 1 | 1 | 50% |
| District 10 | 2 | 0 | 0 | 0% |
| Total | 11 | 6 | 5 | 45.5% |
All five District races featured an incumbent candidate, however, the incumbent candidate in District 2 ran unopposed and therefore was not eligible to receive public financing. A candidate in the District 4 race applied for public financing but was disqualified from appearing on the ballot before their application was reviewed.
B. Candidate Public Financing, Fundraising, and Spending
As discussed above, five of the 11 Supervisorial candidates who qualified to appear on the November 2022 ballot (45%) applied for and were certified as eligible to receive public financing. Together, those candidates received over $1.15 million under the program. Table 2 below shows the total amount of public funds disbursed, as well as the per participating candidate average.
Table 2 – Total Public Funds Disbursed
| Total | Participating Candidate Average | |
|---|---|---|
| Public Funds Disbursed | $1,158,006.00 | $231,601.20 |
Of the five candidates certified as eligible to receive matching funds, four (80%) qualified to receive the maximum amount of public financing allowed. On average, candidates were approved to receive approximately 91% of the maximum amount of public financing allowed. For comparison, in the November 2020 election, on average candidates received approximately 85% of the maximum amount of public financing allowed, with eight out of 16 (50%) approved to receive the maximum allowed.
Table 3 summarizes the amount each candidate was eligible to receive based on program maximums and the actual amount disbursed based on the candidate’s submissions.
Table 3 – Public Funds Disbursed vs. Maximum Eligible Funds, by Candidate
| Candidate Name | District | Public Funds Disbursed | Maximum Eligible Funds | Percent of Eligible Maximum Received |
|---|---|---|---|---|
| Engardio, Joel | 4 | $255,000.00 | $255,000.00 | 100.00% |
| Mar, Gordon (I) | 4 | $252,000.00 | $252,000.00 | 100.00% |
| Dorsey, Matt (I) | 6 | $252,000.00 | $252,000.00 | 100.00% |
| Mahogany, Honey | 6 | $255,000.00 | $255,000.00 | 100.00% |
| Mandelman, Rafael (I) | 8 | $144,006.00 | $252,000.00 | 57.15% |
Tables 3a through 3e indicate, by district, the level and make-up of each Supervisorial candidate’s fundraising and total reported expenditures. The tables show the amount of public financing each candidate received through the program, amount each candidate raised in private funds (not including loans or non-monetary contributions), total funds the candidate received, percentage of total campaign funds attributable to public funds received through the program, and total campaign expenditures reported through December 31, 2022.
Tables 3a through 3e include only candidates who qualified to appear on the ballot and whose committees reached at least $2,000 in contributions raised or expenditures made. Candidates who qualified to appear on the ballot but did not reach the required disclosure threshold have been excluded. Because the incumbent in the District 2 race was not opposed by a candidate who reached the minimum fundraising/expenditure thresholds, the candidate was not eligible to participate in public financing. However, candidate spending for District 2 is included in the tables below.
Table 3a – District 2 Candidates: Public Funds, Contributions, and Spending in the November 2022 Election
| Candidate Name | Public Funds | Private Contributions | Total Funds | Public Funds as % of Total Funds | Total Expenditures |
|---|---|---|---|---|---|
| Stefani, Catherine (I)* | $0 | $125,725 | $125,725 | 0% | $97,851 |
| Total | $0 | $125,725 | $125,725 | 0% | $97,851 |
Table 3b – District 4 Candidates: Public Funds, Contributions, and Spending in the November 2022 Election
| Candidate Name | Public Funds | Private Contributions | Total Funds | Public Funds as % of Total Funds | Total Expenditures |
|---|---|---|---|---|---|
| Engardio, Joel* | $255,000 | $177,967 | $432,967 | 58.9% | $445,768 |
| Mar, Gordon (I) | $252,000 | $156,197 | $408,197 | 61.7% | $425,410 |
| Louie, Leanna^ | $0 | $41,647 | $41,647 | 0% | $41,411 |
| Total | $507,000 | $375,811 | $882,811 | 57.4% | $912,589 |
Table 3c – District 6 Candidates: Public Funds, Contributions, and Spending in the November 2022 Election
| Candidate Name | Public Funds | Private Contributions | Total Funds | Public Funds as % of Total Funds | Total Expenditures |
|---|---|---|---|---|---|
| Dorsey, Matt (I)* | $252,000 | $245,443 | $497,443 | 50.6% | $503,427 |
| Mahogany, Honey | $255,000 | $261,571 | $516,571 | 49.4% | $552,470 |
| Total | $507,000 | $507,014 | $1,014,014 | 50.0% | $1,055,897 |
Table 3d – District 8 Candidates: Public Funds, Contributions, and Spending in the November 2022 Election
| Candidate Name | Public Funds | Private Contributions | Total Funds | Public Funds as % of Total Funds | Total Expenditures |
|---|---|---|---|---|---|
| Mandelman, Rafael (I)* | $144,006 | $223,809 | $367,815 | 39.1% | $333,131 |
| Stoia, Kate | $0 | $24,967 | $24,967 | 0.0% | $24,875 |
| Total | $144,006 | $248,776 | $392,782 | 36.6% | $358,006 |
Table 3e – District 10 Candidates: Public Funds, Contributions, and Spending in the November 2022 Election
| Candidate Name | Public Funds | Private Contributions | Total Funds | Public Funds as % of Total Funds | Total Expenditures |
|---|---|---|---|---|---|
| Walton, Shamann (I)* | $0 | $143,965 | $143,965 | 0.0% | $124,556 |
| Adam, Brian Sam | $0 | $4,530 | $4,530 | 0.0% | $1,274 |
| Total | $0 | $148,495 | $148,495 | 0.0% | 125,830 |
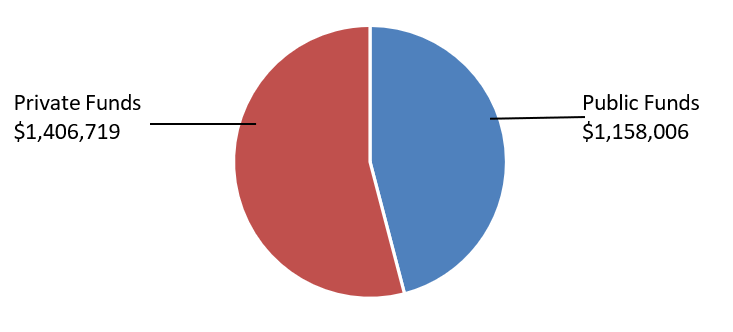
Overall, in these five District elections, public financing represented approximately 45% of these Supervisorial candidates’ total campaign funds for the November 2022 election.[11] Table 4 and Chart 1 show the total amount of public financing received and private contributions raised by all candidates with an established campaign committee across all districts. This includes candidates with activity below the threshold for inclusion in Tables 3a – 3e above.
Table 4 – Districts 2, 4, 6, 8, 10: Total Public Funds Disbursed vs. Private Contributions Raised
| Total Public Funds Disbursed | Total Private Contributions Raised | Total Funds Received | Public Funds as % of Total Funds Raised |
|---|---|---|---|
| $1,158,006 | $1,406,719 | $2,564,725 | 45.2% |
Chart 1 – Supervisorial Districts: Total Public Funds Disbursed vs. Private Contributions Raised
C. Candidate Individual Expenditure Ceilings
As described in Section II above, spending limits are in place for publicly financed candidates that limit the total amount of expenditures a candidate can make or accrue. The Commission can increase the Individual Expenditure Ceiling (IEC) for an individual candidate based on the reported fundraising, spending, and independent expenditures in that candidate’s race. Because candidate IECs are only monitored through the date of the election, only statements and forms, such as candidate Threshold Statements and third-party spending reports, filed through election day are factored into IEC limit determinations. New and amended forms and statements filed after the date of the election are not considered for IEC adjustments.
For the November 2022 election, Commission staff determined that a total of 20 adjustments to candidate spending limits were required. Four of the five candidates certified eligible to receive public financing had their IEC limit raised. For comparison, in the November 2020 election, a total of 46 adjustments were required for 15 of the 16 candidates receiving public funds.
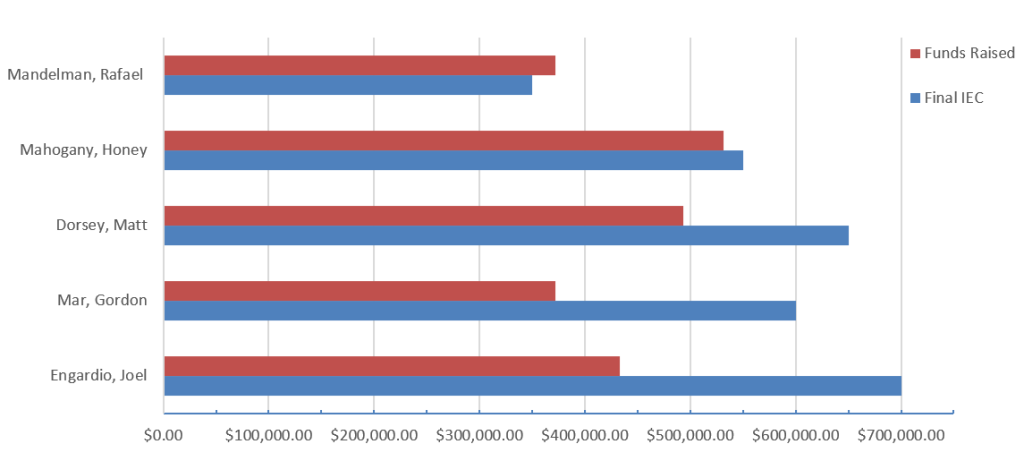
Table 5 below indicates the number of spending limit increases experienced by each publicly financed candidate and the final level to which each candidate’s spending limit was adjusted. The table also indicates each candidate’s total funds raised up to the date of the election.
Table 5 – Number of IEC Adjustments and Highest Adjusted IEC for November 2022 Candidates
| Candidate | District | Number of IEC Adjustments | Highest Adjusted IEC | Total Funds Raised By Election Day |
|---|---|---|---|---|
| Engardio, Joel | 4 | 5 | $700,000 | $432,817 |
| Mar, Gordon | 4 | 6 | $600,000 | $371,739 |
| Dorsey, Matt | 6 | 5 | $650,000 | $493,267 |
| Mahogany, Honey | 6 | 4 | $550,000 | $531,774 |
| Mandelman, Rafael | 8 | 0 | $350,000 | $371,739 |
The “Total Funds Raised” in the table above is drawn from candidate Threshold Statements filed through the date of the election. These statements report the total amount of funds received from all sources including monetary and non-monetary contributions, loans, and public financing.
Chart 2 compares the total funds (private contributions plus public financing) raised by candidates through the election date and the candidates’ final IEC limit.
Chart 2 – Candidate Funds Raised and Final IEC Limit
D. Third-Party Spending (Independent Expenditures)
Third-party committees (including general purpose and primarily formed independent expenditure committees) and individuals not affiliated with candidates reported spending a total of $577,238 in connection with the November 2022 election. This includes amounts disclosed in new and amended forms and statements that were filed after the election and were not factored into determining candidate IEC adjustments.
Of this third-party spending, $457,690 (79%) was spent in support of a candidate, while $119,547 (21%) was in opposition to a candidate, as represented in Chart 3.
Chart 3 – Overall Third-Party Spending in November 2022 Election
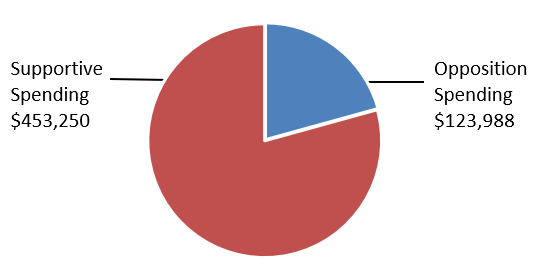
Table 6 outlines the amount of supportive and opposition third-party spending by election race. All five district elections featured incumbents up for re-election. As previously noted, the incumbent in the District 2 race was not opposed by a candidate who reached the minimum fundraising/expenditure thresholds, and therefore was not eligible to participate in public financing.
Table 6 – Third-Party Spending in November 2022 Election by Supervisorial Race
| Contest | Supportive | Opposition | Total Spending |
|---|---|---|---|
| District 2 | $0 | $0 | $0 |
| District 4 | $355,296 | $86,011 | $441,307 |
| District 6 | $93,254 | $37,977 | $131,231 |
| District 8 | $4,700 | $0 | $4,700 |
| District 10 | $0 | $0 | $0 |
| Total for Election | $453,250 | $123,988 | $577,238 |
Table 7 compares and contrasts the total spending by all candidates and third parties (both supportive and opposition spending) in each Supervisorial race. As previously noted, only candidates who reached the reporting threshold are included in the total candidate spending.
Table 7 –Candidate vs Third-Party Spending in November 2022 Election by Supervisorial Race
| Contest | Candidate Spending | Third-Party Spending | Total Spending | % of Spending by Third Parties |
|---|---|---|---|---|
| District 2 | $97,851 | $0 | $97,851 | 0% |
| District 4 | $912,589 | $441,307 | $1,353,896 | 33% |
| District 6 | $1,056,692 | $131,231 | $1,187,923 | 11% |
| District 8 | $358,006 | $4,700 | $362,706 | 1% |
| District 10 | $125,830 | $0 | $125,830 | 0% |
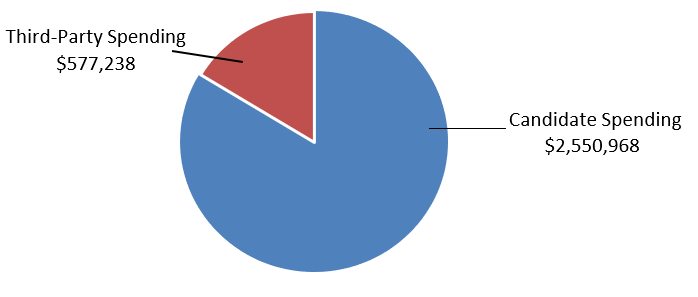
| Total for Election | $2,550,968 | $577,238 | $3,128,206 | 18% |
Chart 4 shows the total amount of third-party spending relative to candidate spending across all Supervisorial races. Third-party spending represented approximately 18% of all spending. For comparison, during the November 2020 election cycle, spending by third parties represented approximately 16% of all spending.
Chart 4 – Candidate vs Third-Party Spending in November 2022 Election
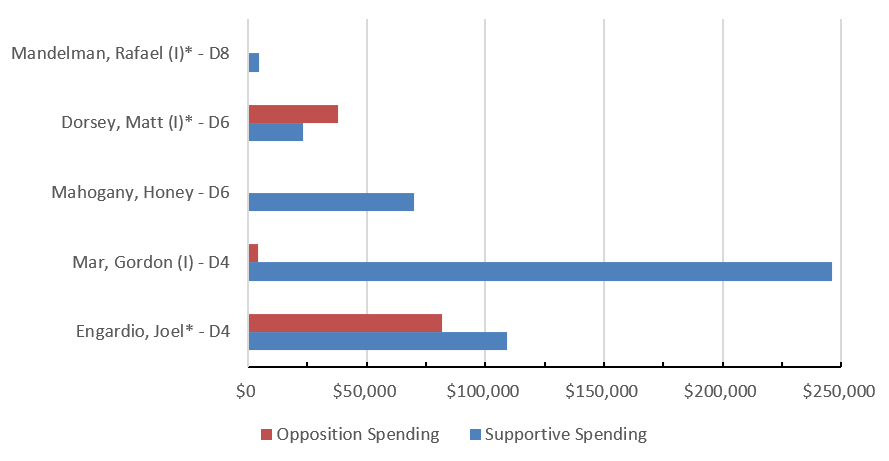
Third-party spending in the November 2022 Supervisorial races affected five candidates in three races. All five candidates received supportive spending, while three candidates were also the object of opposition spending. Table 8 and Chart 5 show the amount of third-party supportive and opposition spending by candidate.
Table 8 – Third-Party Spending in November 2022 Election by Candidate
| Affected Candidate | Race | Supportive Spending | Opposition Spending | Total 3rd Party Spending |
|---|---|---|---|---|
| Engardio, Joel* | D4 | $109,199 | $81,570 | $190,769 |
| Mar, Gordon (I) | D4 | $246,097 | $4,440 | $250,537 |
| Mahogany, Honey | D6 | $70,034 | $0 | $70,034 |
| Dorsey, Matt (I)* | D6 | $23,220 | $37,978 | $61,198 |
| Mandelman, Rafael (I)* | D8 | $4,700 | $0 | $4,700 |
| Total | $453,250 | $123,988 | $577,238 |
Chart 5 – Third-Party Spending in November 2022 Election by Candidate
IV. Conclusion
The purpose of this report is to provide background on program components across election cycles to help increase understanding and participation in the program and maximize its effectiveness in City campaigns. Prior reports have been produced for each election in which the program has been utilized. This reporting history creates a consistent, high-level record of the program’s use throughout its existence. By producing and publishing this information, the Ethics Commission seeks to ensure that the public and City officials have transparency into the use of public funds and access to the most current information about the program – both of which are vital to supporting both its availability and effectiveness in future City elections. The report also assists with ongoing efforts to study and improve the program, which, as discussed in Section II above, was done most recently in 2018-19.
This report is primarily descriptive, and a more comprehensive analysis of the recent changes to the program may be performed in the future through a separate review process. However, there are certain noteworthy observations that can be made from the data provided in the report and Appendix 1, which provides select data for each election since 2002 in which a Supervisorial election occurred.
- Lowest number of qualified candidates appearing on the ballot. The 2022 election marked the lowest number of qualified candidates appearing on a ballot for a regular supervisorial election (11 qualified candidates) since the program started in 2002. This likely contributed to the second lowest number of participating candidates at five (the 2014 elections saw only two candidates participate in public financing). A contributing factor could be that all five district races featured an incumbent candidate. Despite the low number of candidates appearing on the ballot, participation in the program was 46%, which was consistent with the rate of participation seen in six of the last eight regular supervisorial elections.
- Public funds continued to represent a high proportion of candidate spending. Public funds as a proportion of total candidate spending reached their second highest level since the program’s creation. Supervisorial candidates in 2022 spent a total of $2,550,968 and received $1,158,006 in public funds. This means public funds were equal to approximately 45.4% of total candidate spending. This is the second highest mark (64% in 2020) since the creation of the program.
- For the second year in a row, third-party spending was at near all-time lows. As noted in the 2020 post-election report, spending by third parties that year was one of the lowest since inception of the program at 17% of total spending. Candidates in all six district races were targeted by third-party spending, at an average of $202,217 per district and $84,698 per candidate. In the 2022 races, third-party spending was at a similar level. Third-party spending represented 18% of total spending. Candidates in three districts were targeted at an average of $192,412 per district and $115,447 per candidate. This marks the first time that third-party spending represented less than 20% of total spending in back-to-back election cycles since the program’s inception. It is worth noting that 76% ($441,306) of third-party spending was directed at two candidates in the District 4 race. Factoring for this, third-party spending averaged only $67,965 per district and $45,310 per candidate, which were historic lows.
Ethics Commission Staff will continue to evaluate these trends to determine the effects of the changes made to the program during the recent review project and to assess the possible need for any future changes. Data from the 2022 election will be necessary in order to provide a broader set of data and to correct for any unique effects caused by the COVID-19 pandemic.
For more information about the public financing program, please visit the Ethics Commission’s website.[12] Data regarding campaign finance in the 2022 election, including the data used to compile this report, is available through the Commission’s Data Dashboards[13], by viewing public disclosures filed by campaign committees[14], or as open- source data derived from these public filings.[15]
APPENDIX 1: Overview of Data for the Public Financing Program
The table below provide summary data of prior supervisorial elections since the creation of the public financing program.
| Election Year | 2002 | 2004 | 2006 | 2008 | 2010 | 2012 | 2014 | 2015 | 2016 | 2018* | 2019 | 2020 | 2022 |
|---|---|---|---|---|---|---|---|---|---|---|---|---|---|
| Amount of Public Funds Disbursed | $281,989 | $757,678 | $216,784 | $1,315,470 | $1,477,713 | $1,228,097 | $194,710 | $307,500 | $1,522,296 | $1,513,465 | $307,500 | $3,455,177 | $1,158,006 |
| Average Amount of Public Funds Disbursed | $31,332 | $32,943 | $36,131 | $69,235 | $67,169 | $102,341 | $97,355 | $153,750 | $126,858 | $137,588 | $153,750 | $215,948 | $231,601 |
| Number of Candidates who Qualified for the Ballot | 28 | 65 | 26 | 42 | 46 | 26 | 17 | 3 | 28 | 25 | 4 | 26 | 11 |
| Number of Participating Candidates | 9 | 23 | 6 | 19 | 22 | 12 | 2 | 2 | 12 | 11 | 2 | 16 | 5 |
| Participating Candidates as % of All Candidates on Ballot | 32% | 35% | 23% | 45% | 48% | 46% | 12% | 67% | 43% | 44% | 50% | 62% | 45% |
| Number of Seats up for Election | 5 | 7 | 5 | 7 | 5 | 6 | 5 | 1 | 6 | 6 | 1 | 6 | 5 |
| Number of Contested Seats | 4 | 7 | 5 | 7 | 4 | 4 | 4 | 1 | 6 | 6 | 1 | 5 | 4 |
| Contested Seats as % of All Seats up for Election | 80% | 100% | 100% | 100% | 80% | 67% | 80% | 100% | 100% | 100% | 100% | 83% | 80% |
| Percentage of Elected Candidates who were Publicly Financed | 60% | 43% | 20% | 71% | 60% | 50% | 0% | 100% | 67% | 83% | 100% | 83% | 60% |
| Percentage of Incumbents Re-Elected | 100% | 100% | 100% | 100% | 100% | 80% | 100% | 0% | 100% | 67% | 0% | 100% | 80% |
| Total Amount of Candidate Spending | $2,213,316 | $3,654,616 | $1,781,148 | $3,875,551 | $3,581,175 | $2,987,290 | $1,542,741 | $1,075,617 | $3,916,575 | $5,374,143 | $935,675 | $5,428,682 | $2,550,968 [16] |
| Average Spending per Qualified Candidate | $79,047 | $56,225 | $68,506 | $92,275 | $77,852 | $114,896 | $90,749 | $358,539 | $139,878 | $214,966 | $233,919 | $208,795 | $228,142 [17] |
| Public Financing Distributed as % of Total Candidate Spending | 12.7% | 20.7% | 12.2% | 33.9% | 41.3% | 41.1% | 12.6% | 28.6% | 38.9% | 28.2% | 32.9% | 63.6% | 45.4% |
| Amount of Third-Party Spending | $261,906 | $251,201 | $543,063 | $1,324,241 | $1,305,460 | $1,507,057 | $96,610 | $1,037,259 | $2,130,147 | $2,272,744 | $363,126 | $1,101,084 | $577,238 |
| Third-Party Spending as % of Total Spending | 11% | 6% | 23% | 25% | 27% | 34% | 6% | 49% | 35% | 30% | 28% | 17% | 18% |
[1] Campaign & Gov. Conduct Code § 1.156.
[2] Id. at § 1.138(b).
[3] US Census Bureau Quick Facts: San Francisco. July 2021.
[4] Campaign & Gov. Conduct Code § 1.138(b)(1).
[5] Id. at § 1.138(b)(3)–(4).
[6] Id. at § 1.154(b)(1)–(2). CFRO sets $7.50 per resident, plus fifteen percent for administrative costs, as the minimum for a regularly scheduled mayoral election and $1.50 per resident plus fifteen percent as the minimum for a regular Supervisorial election.
[7] Reported ECF balance on July 1, 2020 (FY21) was $6,999,506. Public funds disbursements in FY21 totaled $2,778,172.
[8] For a contribution over $100, only $100 of the contribution is counted as a qualifying contribution.
[9] Campaign & Gov. Conduct Code § 1.140.
[10] Candidates “apply” for public financing by submitting a Qualifying Request, also known as a Declaration, to the Ethics Commission. In this filing, a candidate must agree to all program rules and must demonstrate having met all requirements, including the minimum fundraising threshold.
[11] As noted in Appendix 1, if candidate expenditures (rather than candidate total funds received) are analyzed, distributions made through the program were equal to approximately 46% of candidate expenditures.
[12] Information available at sfethics.org.
[13] Available at sfethics.org.
[14] Available at https://public.netfile.com/pub2/?aid=sfo.
[15] Available at sfethics.org.
[16] This amount reflects the total spending by all 12 candidates with registered campaign committees, including the District 4 candidate who was Disqualified
[17] This amount reflects the average spending by the 11 candidates who qualified to appear on the ballot. Total spending by these candidates was $2,509,557